For each working cycle and each vibration measurement point (consisting of X- Y- Z-channel + sum) a spectral analysis may be performed.
Please note, that the spectra analysis is calculated without considering potential trigger conditions because it would be strongly distorted by artefacts due to switching on and off.
For each channel FFTs will be calculated which are overlapping by 50%. All these FFTs are averaged.
As the window function, Hanning window is used. The Hanning window provides a good compromise between frequency selectivity and amplitude accuracy.
The sum channel is calculated for each spectral line according to the formula
The power spectrum (= square of the amplitude spectrum) is calculated.
Please note that with lower spectral resolution (= smaller FFT window width) a wider section of the spectrum is represented by one FFT line. Depending on
spectral distribution of the signal, the accumulated amplitude (power) of the individual FFT line may change..
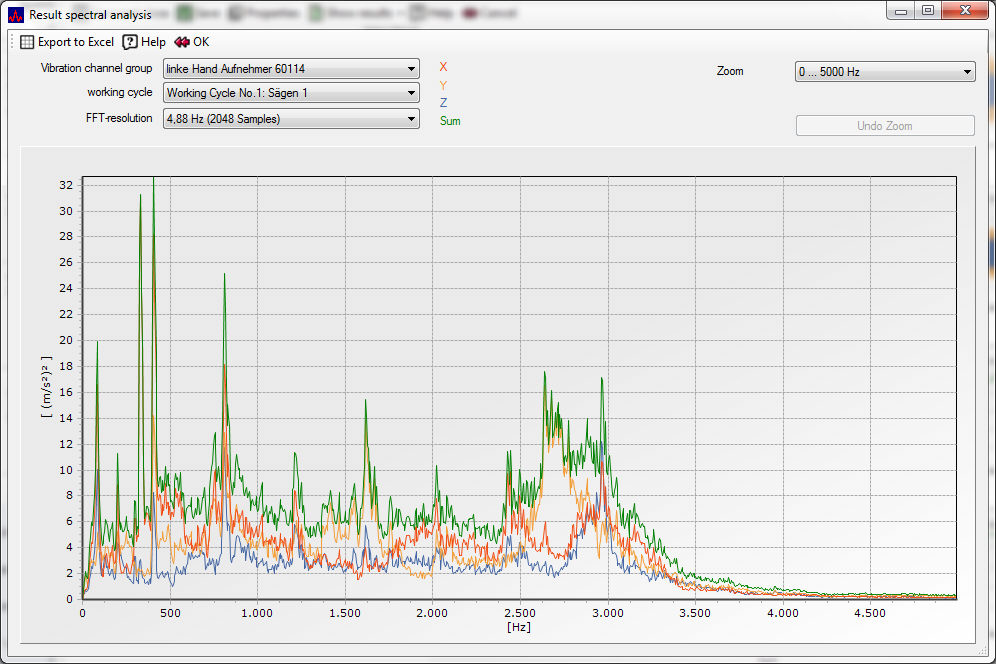
If you have more than one vibration measurement group (triaxial measuring point with X, Y and Z axes), you may select it here.
If you have defined more than one working cycle, you may select it here.
You can change the FFT resolution and therefore the FFT window length.
The larger the window length is, the higher the spectral resolution.
Per default, the display range goes up to half of the sampling rate. If you are not interested in higher frequencies, you can reduce the upper display range here.
This setting also applies to the graphics in the Excel output.
You can zoom in the image by pressing the left mouse button and moving the mouse with holding the left mouse button to the right and then release the left mouse button.
This procedure can be repeated several times if necessary to get accurate details to watch.
You get back to the original display by pressing the left mouse button and moving the mouse to the left while holding the left mouse button and then release the left mouse button.
You can also click the Button "undo zoom".
This setting also applies to the graphics in the Excel output.
Spectral analysis can be exported to Excel.
FFT resolution and display area of the frequency as selected in the dialogue. The Zoom
is displayed for all working cycles as selected in the dialogue.
For each vibration channel group and for each working cycle a spreadsheet is
created with a graphic and related raw data.
Please note that the graphics in the Excel export reflects your zoom and display range..
For keywords see 'Defining your own EXCEL templates